Classification and Detection with Convolutional Neural Networks
cnn computer-vision
 by
omniji
by
omniji
Introduction
In this report, 3 CNN networks are built based on the SVHN data set [1], to detect random numbers in pictures/videos, regardless of the numbers’ location, scale, font and direction (angle). The performance of the 3 CNN network are compared, and the one giving the best test results is used for final picture/video detection. Different image pre-processing and number localization are also investigated to yield better accuracy and performance.
Previous Works
Traditional number detection images involve 3 steps – localization(find the locations of numbers), segmentation(separate the numbers) and recognition (recognize the numbers)[1]. In[2], a unified approach that integrate the 3 steps was proposed, and gained 96% accuracy on the SVHN dataset. Instead of cropping individual numbers, the work in [2] recognize all numbers in the series. This report will take the same approach.
Data Set
The trainings and validations of CNN in this report are based on the SVHN data set. It has two formats: 1) individual numbers are cut and placed in 32x32 images, and 2) the entire series are all in one image but the bounding box and location info are given. Format 2) is used in this report since we hope to recognize the entire series at once instead of recognizing them individually.
The SVHN data set contains 30k, 10k, 200k series in training, test and extra data sets. However, only less than 50 5-digit series present in the dataset. Thus the results training on digit length>4 can be bad. In this report, the length of series is kept <=5. Note that the digit length=5 is kept here just to see how it could perform.
The label of each image containing a series will be an array of length 6:
Label=[ length_of_series, number1, number2, number3, number4, number5 ]
The “Length of series” range from 0 to 5, where 0 means that there are not number series in the image. The numbers range from 0 to 10, where 10 means that it’s not a number.
Negative examples are cut from the train examples where the area that are not numbers is large enough. It generates ~50k negative examples, and 10k of which are added to the training & validation set, while 1k of them are added to the test set.
The final train, validation, test set sizes used are: 113k, 20k, 13.5k.
Data preprocessing
In this work, both approaches of the mean subtraction were applied, as well as the data normalization.
When feeding our data to a CNN network, some preprocessing is required to yield better performance. Common approaches including Mean subtraction and Normalization[3]. Mean Subtraction can take 2 forms. First one is that it calculates the mean value of all image data then subtract the mean from the input image array[3]. This will bring the center of the cloud of data to zero. The second form is to subtract the mean of each image itself[2], this will help when the input images have different light conditions. Normalization can be done by dividing the input data by its standard deviation, so that the data can be approximately the same scale.
During prediction, the mean and standard deviation of the train data stored in a pickle file will be retrieved for mean subtraction and normalization. A Gaussian blur with filter size of 3x3 will also applied on the image to reduce the impact of noise.
Neural Network Architectures
-- Layers
There are several types of layers used in this work:
- Convolutional 2D layer
Core layer of the CNN networks. Instead of connecting all nodes in the previous layer as in regular neural networks, a neuron in the convolutional layer is only connected to a portion of the previous layer. Moreover, it has a 3rd dimension, the “depth” since it has a multilayer perceptron structure, defined by the number of filters in the convolutional layer. Hyperparameters including depth, stride and paddings will affect the way it does convolutional computations on the previous layer. - Pooling layers
Pooling layers are occasionally inserted between consecutive convolutional layers to reduce the spacial size and number of parameters in the network, which will help reducing overfitting.
- Flatten layers
Before adding the output layer (which are fully connected ANN layers), we need to flat the the convolutional layers into a 1d vector. - Dense layers
Dense layers are fully connected ANN layers (the output layer).
-- Self-designed model:
Layers in the self-designed model include:
- Input layer of size (48,48,3)
- 4 Conv2D layers with filter size of 3x3, with 48, 64,128,160 filters, all using RELU as activation function.
- All Conv2D layers are followed by a pooling layer with size 2x2.
- Flatten layer added to prepare for output
- The output layer, consisted of 6 softmax Dense layers, for the length, number1 to number 5.
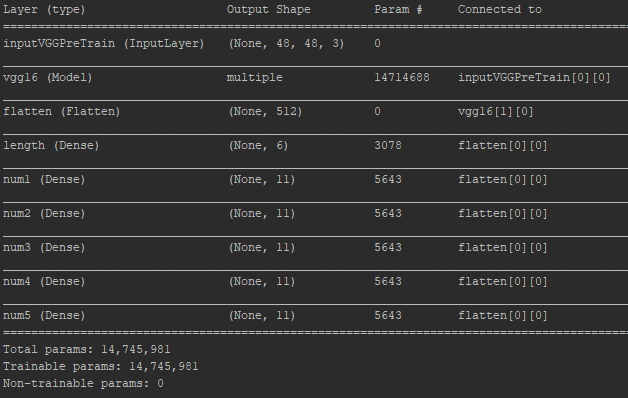
Left: self-designed model structure Right: VGG16 structure
-- VGG16 (with & without pre-trained weights):
The structure of the two VGG16 networks are the same in this report. Only the input & output layers are updated. The input layer was updated to have size of (48,48,3) considering that the minimum input image size VGG16 can take is 48x48 [8]. A flatten layer is added after the vgg16 (output layer removed), followed by a new output layer consisted of 6 softmax layer (same with the self-designed model).
In the VGG16 network with pretrained weights, the “Imagenet” weights were initialized, which were previously trained to classify pictures into 1000 categories.
On the other hand, in the VGG16 network trained from scratch, weights are randomly initialized. The network was then trained with the SVHN data.
Parameters used in CNN
Loss Function:
Loss function, or sometimes called “cost function”, measures how good the prediction of the model is when compared to the expected outcome. Intuitively, if the prediction works well the loss will be low, and high vise versa.
In this work, “sparse_categorical_crossentropy” was used as the loss function, since the output of the networks are integer target instead of one-hot encoding.[7]
Learning Rate:
We train the weights of our neural network to optimize the loss function, so we need to update the weights in the direction that will improve the loss function. This direction can be decided by calculating the gradient of the loss function, and the steepest direction that will improve cost function is the one to choose. However only knowing the direction is not sufficient, we also need to know the step size we’ll take in that direction, which is the learning rate.
If the learning rate is too high, we might step over the optimum weights and get worse loss. If the learning rate is too low, the training time will be long.
In this work, ReduceLROnPlateau was implement as a callback funcion to dynamically control the learning rate. An initial value of 1e-03 is set for the learning rate, and it will reduce when the validation loss does not improve.
Batch Size:
When we have a large number of training examples, it’s computationally expensive to calculate the gradient using all examples, thus a common approach is to calculate the gradient over only a batch of data.[6][3] When the batch size is too small it might be no different from randomly wandering around all directions. So while the batch size can be small, it also has to at least be able to correlate to the dataset. Common batch sizes are 32,64,128. Power of 2 numbers are used here because vectorized calculations are usually faster if the size is power of 2. [3]
Batch size of 32, 64, 128 are tried with vgg16 with pretrained weights with 5 epochs, and batch size 128 gives the best test accuracy. Thus batch size 128 is chosen for the training here.
When to stop training:
An early stopping callback was implemented for model training. It monitors the validation loss and will terminate when the improvement is smaller than 1e-06. A maximum of 50 epoch is also applied, the training session will end if either the early stopping happens or the max epoch is reached.
Localization
The first approach experimented was using a sliding window of different sizes, cut the image within the window and feed into the CNN network. This process is extremely time consuming, it takes more than 2 minutes to process a single picture. The problem with this is that, when the window contains the partial series, the returned confidence can be really high, and the number of these high-confidence predictions can be several hundreds, making it very difficult to threshold and screen to get the correct prediction.
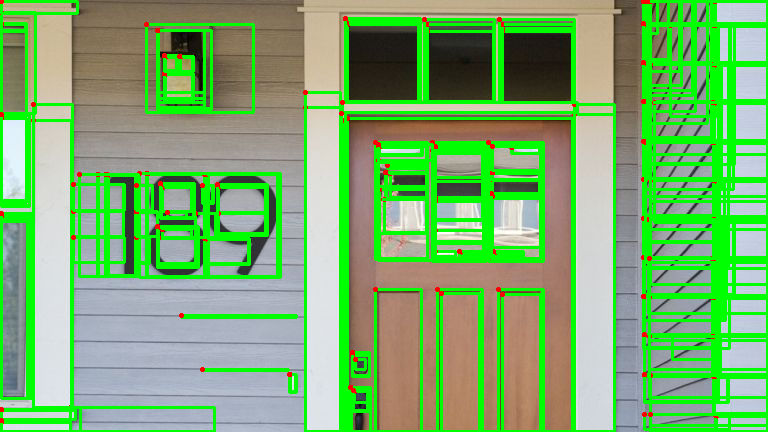
To improve the performance and accuracy, MSER (from opencv) was used to detect the Maximally Stable Extremal Regions (shown in picture below).
The regions with similar area, width/height ratio, x/y location are grouped together. The number of cut images fed into the CNN network is significantly reduced, as well as the number of false sub-windows.
Left: output of MSER right: boxes after grouping

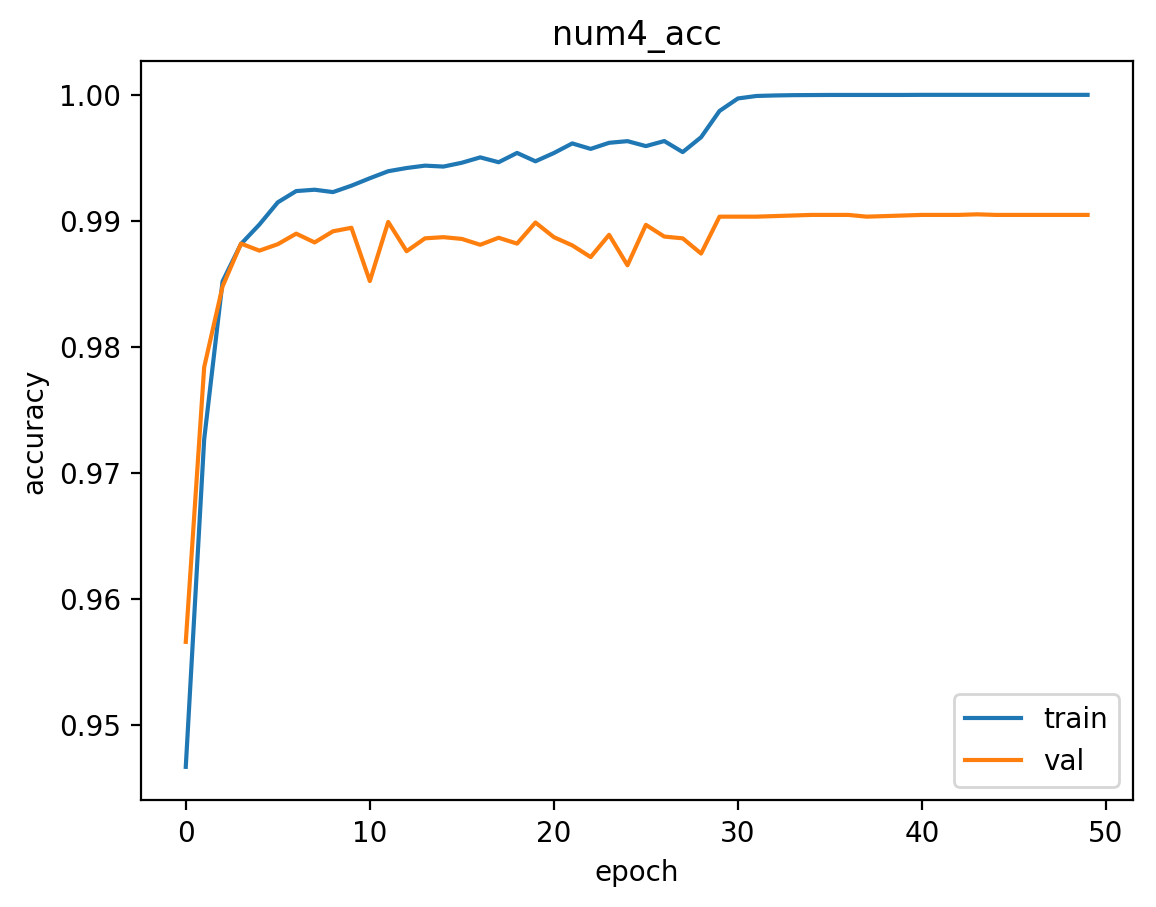
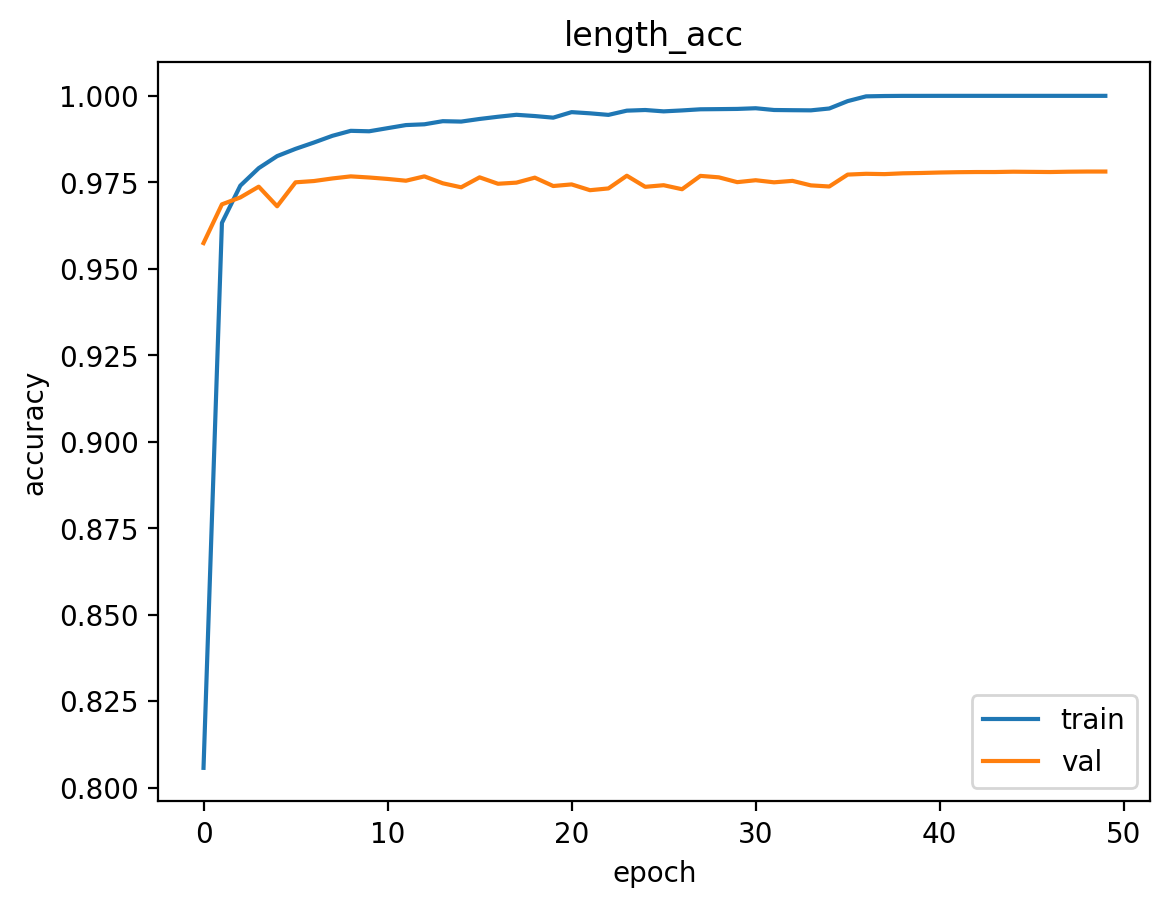
Train, Validation, Test accuracies:
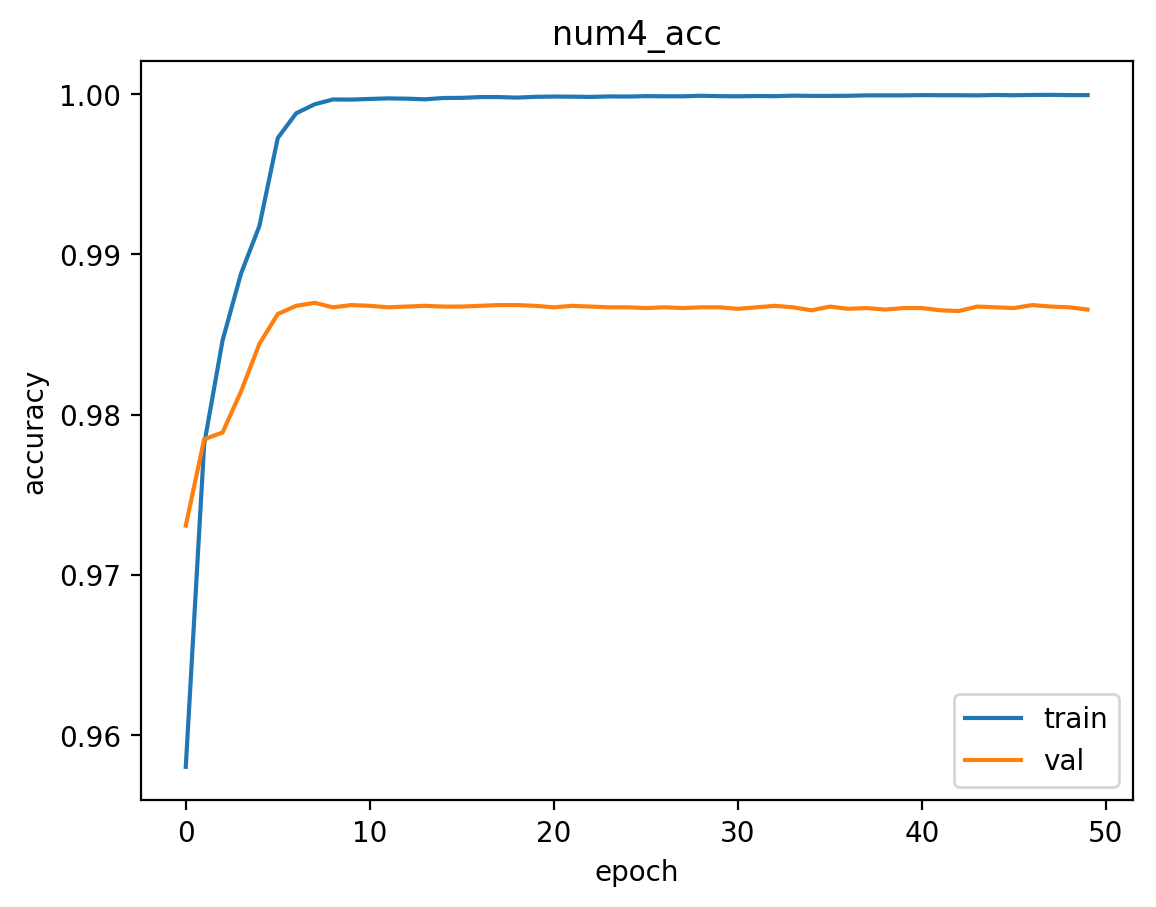
The train & validation accuracy vs epoch are drawn below. The two VGG16 models give very close performance, and the self-designed model comes third. Note the the accuracy of number#5 is very high. This is because there are only a small number of 5-digit series in the examples, and will have “10” (not a number) as the true value. So The accuracies here are not reasonable for number#5. A balanced sample will be needed in future works.
|
Test & Validation accuracies of: length of number, number1, number4, number5 (number2 & 3 are similar to number1 results so they’re not shown) |
|
|
VGG16 with |
|
|
VGG16 |
|
|
Self designed model |
|


The train/validation/test accuracies of the train/validation/test of the 3 models are shown below. VGG16 with weight performs the best over all. Although it has slightly lower series accuracy(all numbers in series are correct), test results of all other digits and the length are better. Thus VGG16 with pretrained weights will be chosen for the image & video detection.
|
data set |
model |
length acc |
num1 acc |
num2 acc |
num3 acc |
num4 acc |
num5 acc |
series acc |
|
train: |
vgg (with weight) |
100.00% |
100.00% |
100.00% |
100.00% |
100.00% |
100.00% |
100.00% |
|
train: |
vgg no weight |
100.00% |
100.00% |
100.00% |
100.00% |
100.00% |
100.00% |
99.99% |
|
train: |
self designed |
99.99% |
99.97% |
99.97% |
99.99% |
100.00% |
100.00% |
99.93% |
|
val: |
vgg (with weight) |
97.96% |
97.17% |
96.36% |
97.07% |
99.05% |
99.95% |
91.57% |
|
val: |
vgg no weight |
97.81% |
97.07% |
96.47% |
96.97% |
99.07% |
99.93% |
91.49% |
|
val: |
self designed |
97.51% |
96.24% |
95.03% |
95.70% |
98.66% |
99.94% |
88.20% |
|
test: |
vgg (with weight) |
97.38% |
95.79% |
95.24% |
97.62% |
99.70% |
99.99% |
90.35% |
|
test: |
vgg no weight |
97.23% |
95.88% |
95.15% |
97.50% |
99.67% |
99.98% |
90.47% |
|
test: |
self designe |
96.13% |
94.22% |
92.79% |
96.27% |
99.56% |
99.99% |
86.32% |
Prediction Results
-- Image detection:
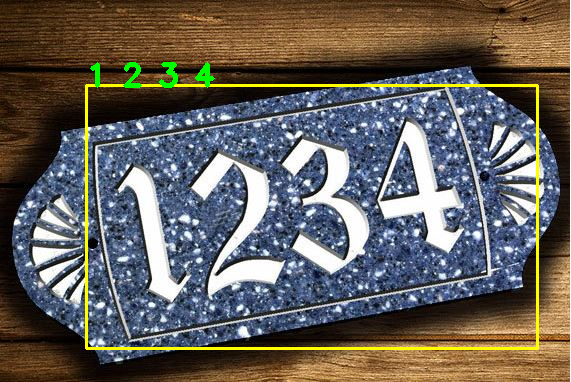
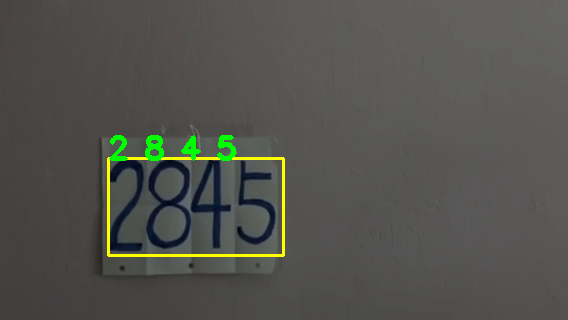
Different images with different font, locations, scales, poses, light conditions are tested and shown below. It does well in many cases, but as we can see in the negative results, the localization part sometimes cannot provide accurate locations of the series, leading to some false positives. Improvements will be needed to better localize and threshold the results.
a. Positive results:


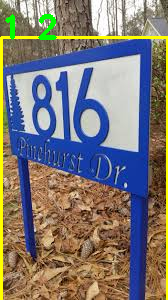
b. negative results:


-- Video detection:
In the video, the camera tried different scales, locations and positions. It also added salt-pepper noise, and adjusted the light conditions. The model did good jobs on most of the frame, but still, predict some false numbers when the camera is tilted. One possible reason is that the number of tilted examples might be small, since no data augmentation were done on the training set in this work. If more examples are generated by rotating the existing training examples, this can be improved.
a. Positive results:


B. Negative results:


Possible Improvements
Best test accuracy I have is from the VGG16 network with pretrained weights, which is around ~90%. It is quite lower when compared to work in [2] which has 96%, and human performance (98%)[2].
One important future improvement is to generate variations of the current train set. From the video results we see that the numbers jump in several frames when the number is tilted. That indicates the training on various directions of the series can be improved. Augmenting the training data set by rotating, relocating should help.
Another possible improvement is on the localization part. Grouping similar MSER boxes works in many cases where each number in the series have similar shape. However when there is “1” in the series it often doesn’t work so well since it’s typically narrower than the other numbers. To improve this, the merged box could be enlarged by certain margins to cover this case. This can also be trained better if boxes in train set are enlarged, then augment more image where the serie is in different locations.
Furthermore, the performance of 5 digit series is quite bad, due to the lack of training samples. It should be helpful if effort is made to generate a data set with balanced length of series.
References:
[1] Yuval Netzer, Tao Wang, Adam Coates, Alessandro Bissacco, Bo Wu, Andrew Y. Ng Reading Digits in Natural Images with Unsupervised Feature Learning NIPS Workshop on Deep Learning and Unsupervised Feature Learning 2011
[2] Multi-digit Number Recognition from Street View Imagery using Deep Convolutional Neural Networks, Ian J. Goodfellow, Yaroslav Bulatov, Julian Ibarz, Sacha Arnoud, Vinay Shet
[3] http://cs231n.github.io/neural-networks-2/#datapre
[4]Hyvarinen, A., Karhunen, J., and Oja, E. (2001). ¨ Independent Component Analysis. Wiley-Interscience
[5]Dean, J., Corrado, G., Monga, R., Chen, K., Devin, M., Le, Q., Mao, M., Ranzato, M., Senior, A., Tucker, P.,Yang, K., and Ng, A. Y. (2012). Large scale distributed deep networks. In NIPS’2012
[8] https://forums.fast.ai/t/how-to-use-pretrained-vgg16-model-for-an-imageset-of-75x75-pixels/7438/3
kkkkk
+1